


Breadcrumb
Infographics
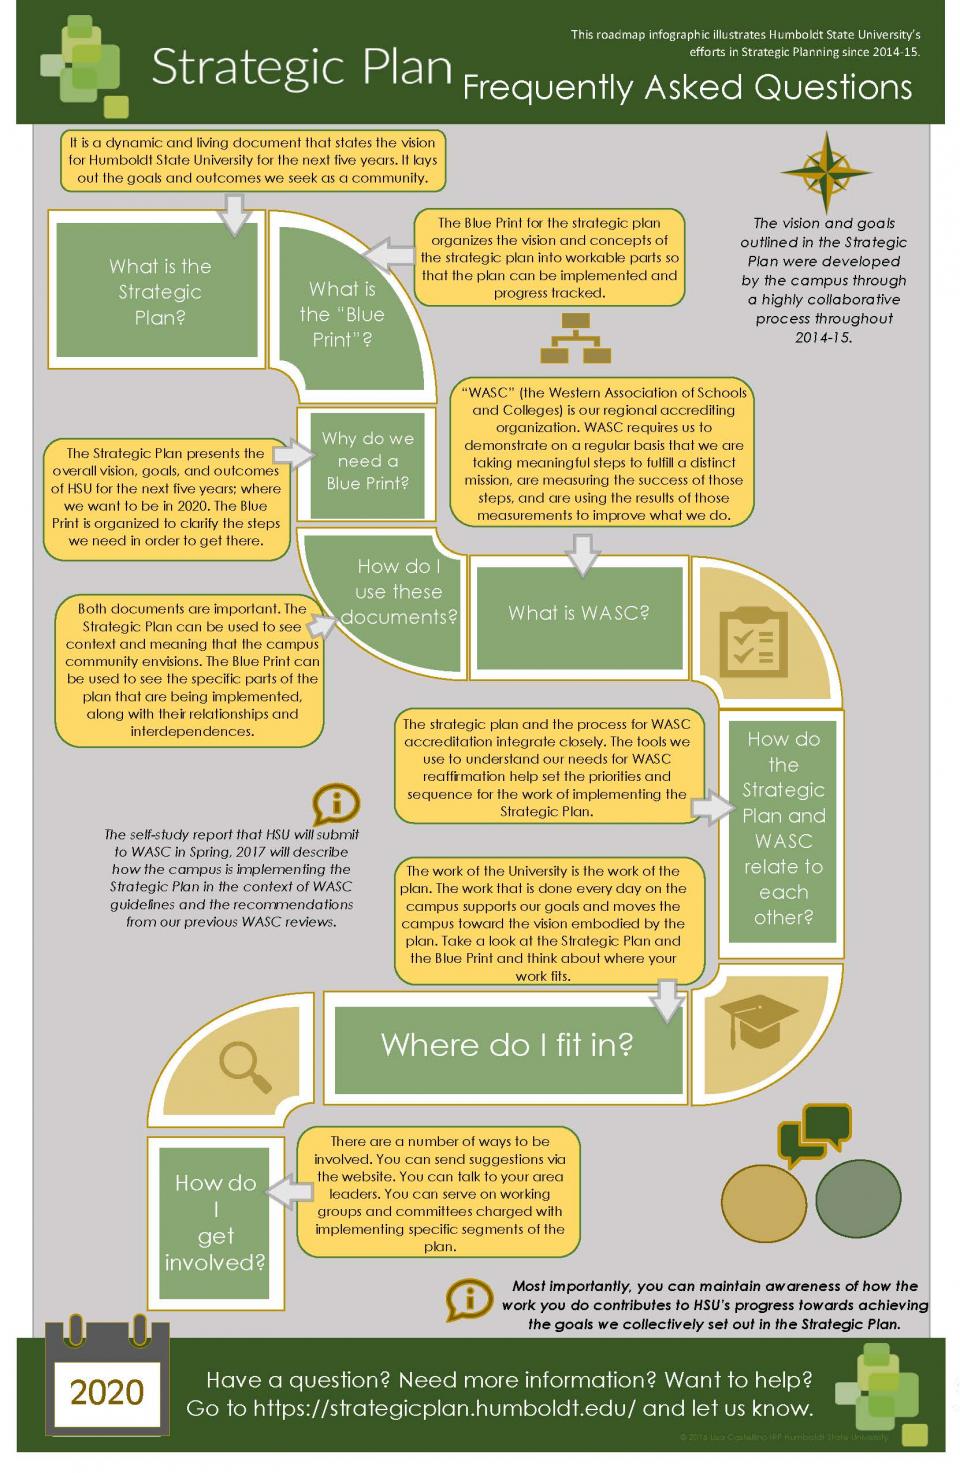
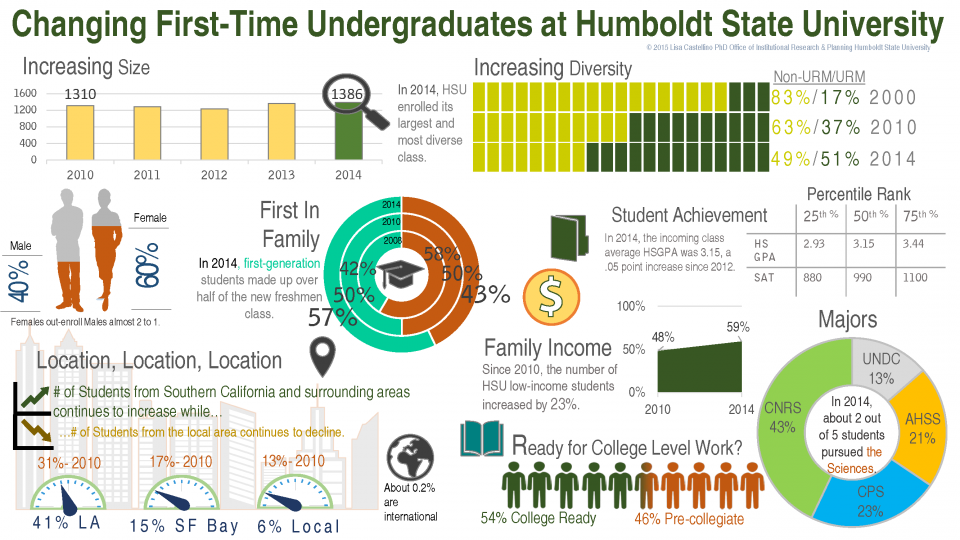
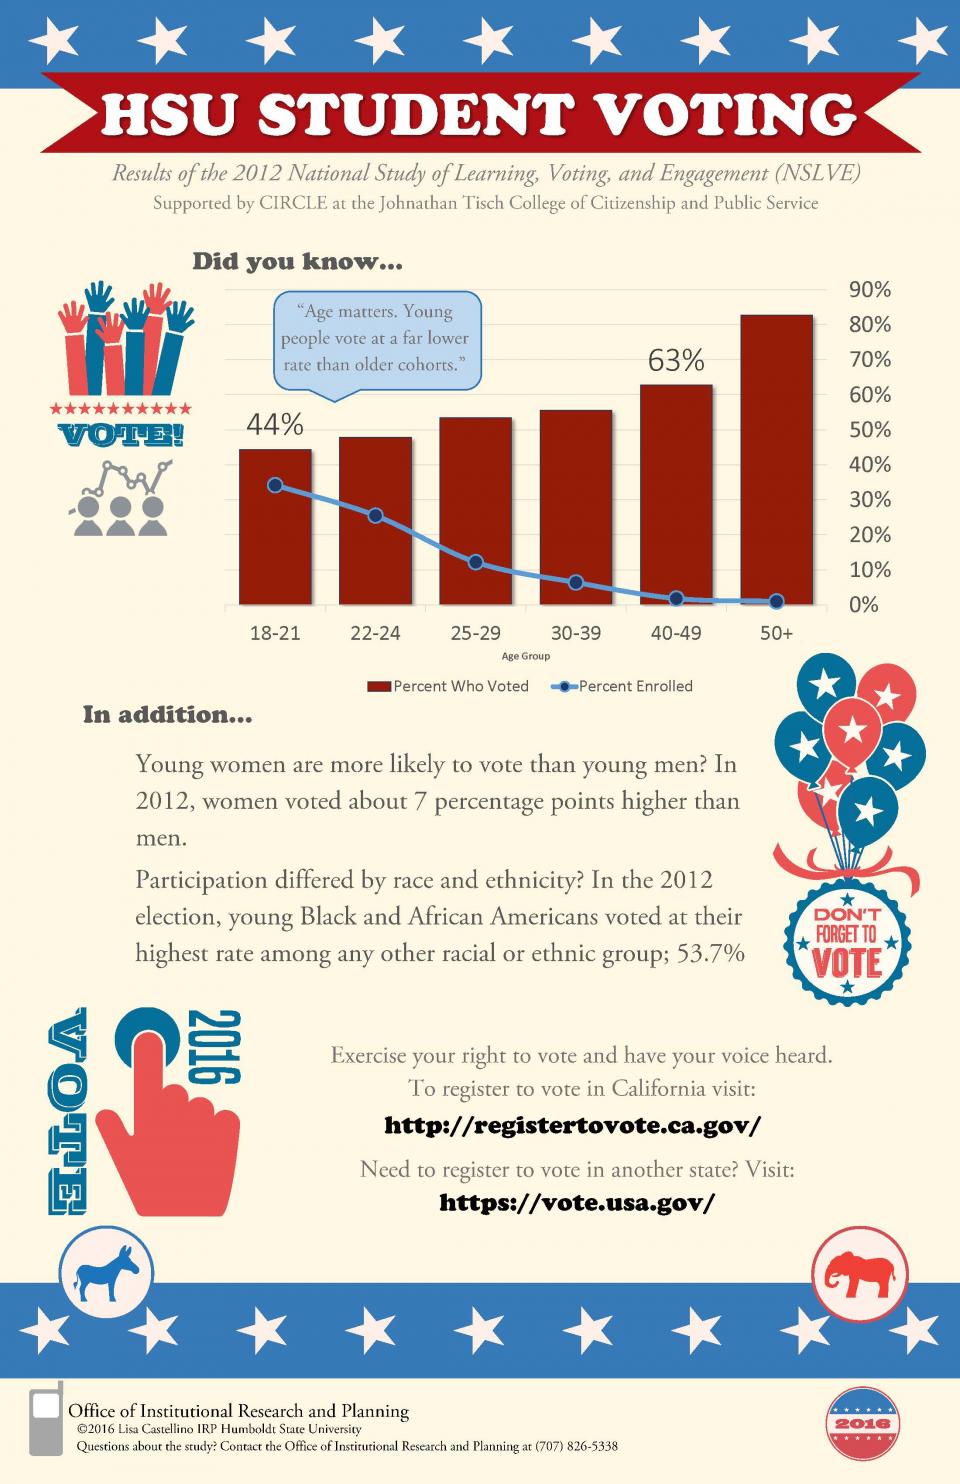
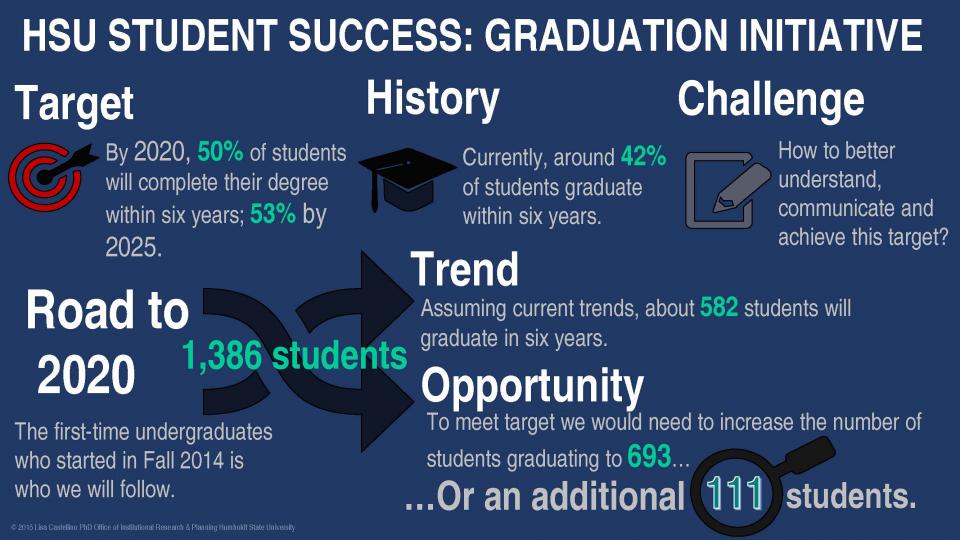
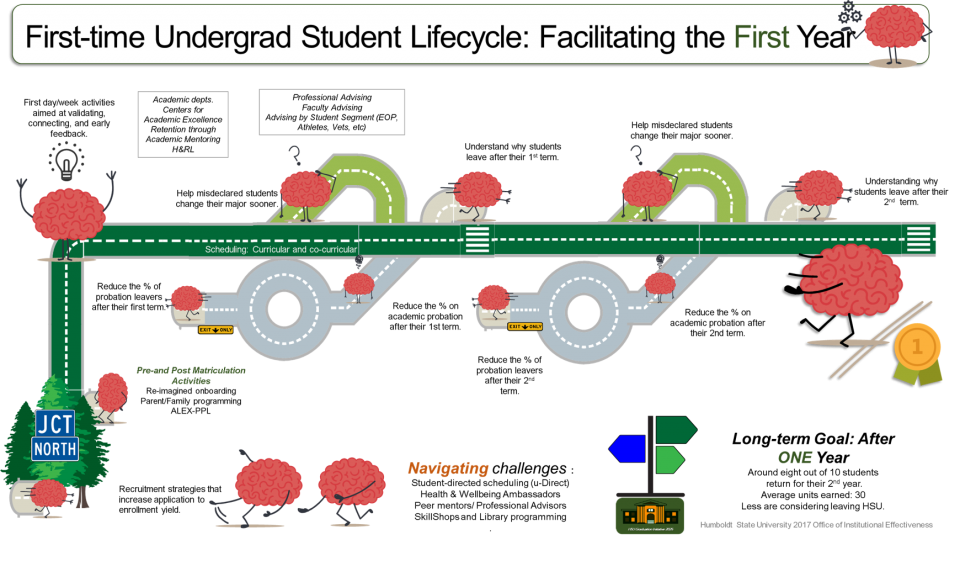
Another way data tell a story is through infographics. These curated, highly structured, and colorful one or two page documents are a powerful messaging vehicle to explain data to a wide ranging audience. Infographics produced by IRAR are housed here. Have an idea for an infographic? Email us at irar@humboldt.edu
Image
Image
Image
Image
Image
Image