Prior Year - Fall 2018
Cal Poly Humboldt Statistical Profile
| Affiliation | Part of 23-campus California State University system |
| President | Tom Jackson |
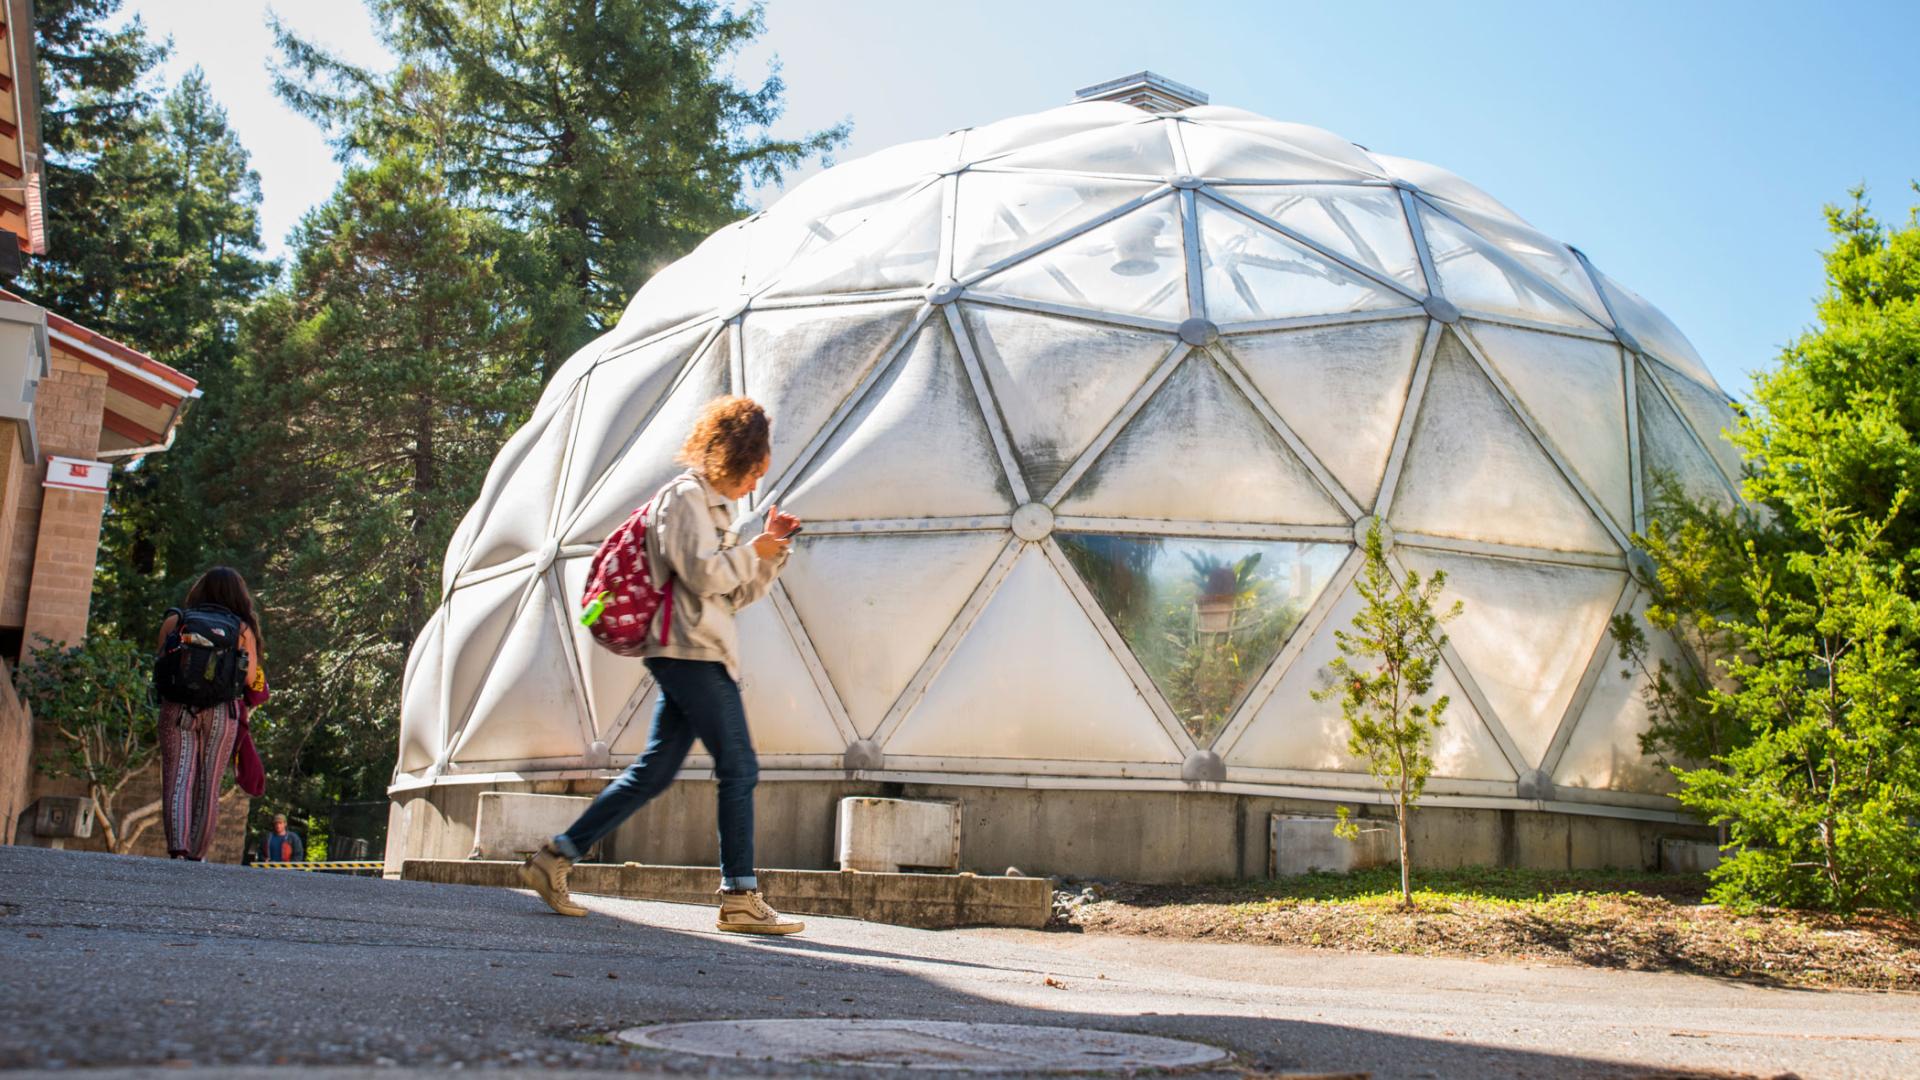
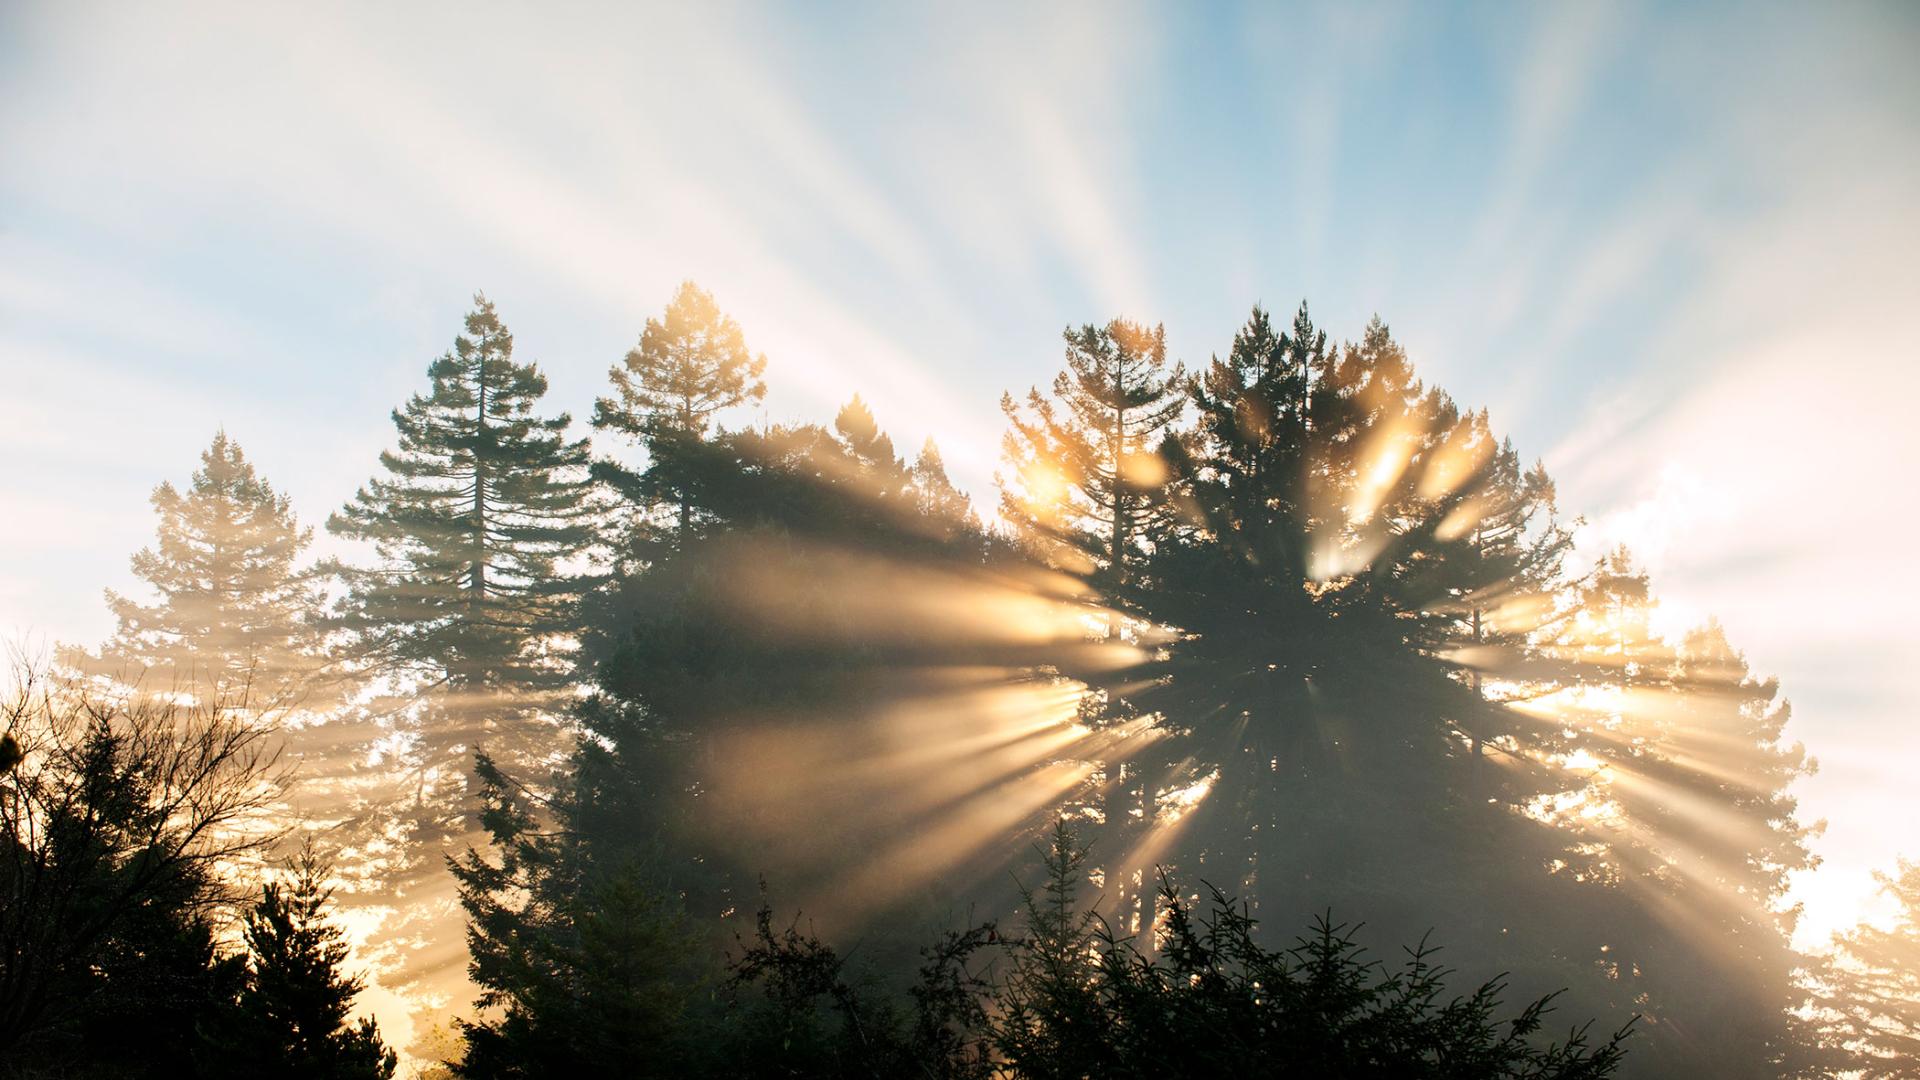
| Where we are located | Located in Arcata, 270 miles north of San Francisco and 95 miles south of the Oregon border, on 144 acres of land, it is nestled in a spectacular setting of redwood forests, rushing rivers, ocean beaches, and mountain ranges. |
| Average temperature and rainfall | Summer temperatures average 63 degrees in Arcata and 92 degrees just 40 miles inland in Willow Creek. Year round temperature averages 57 degrees.Overall, Humboldt County receives an average of 37.5 inches of rain per year. |
| Academics | Many study options are available to Humboldt students. There are 51 baccalaureate degree majors of which are 86 options/concentrations. There are also 73 minors, 12 graduate programs, 14 credential programs including 6 single subject credentials, and several certificates of study. |
| Facilities | - 144 acres main campus
- Plus an additional 591 acres which Humboldt owns, leases or has use agreements to (marine lab, observatory, natural history museum, saltwater marsh, freshwater marsh, small lakes and ponds, forest lands, sand dune preserve, research vessel, First Street Gallery, and the Wildlife Care Facility).
- 963,127 square feet in 90 buildings |
| Carnegie Classification | Public Master's Colleges and Universities (medium programs) |
Fall 2019 Enrollment
| | Fall 2019 | Fall 2018 | Change |
| Student Headcount | 6983 | 7774 | -10.2% |
| Full-Time Equivalent Students | 6658 | 7362 | -9.6% |
| First Time Undergraduates | 810 | 1020 | -20.6% |
| Transfer Students | 759 | 834 | -9.0% |
| Continuing Undergraduates | 4518 | 4893 | -7.7% |
| Masters Enrollment | 337 | 376 | -10.4% |
| Credential Enrollment | 121 | 130 | -6.9% |
Fall 2019 Enrollment by Student Class
| Student Class | Female | Male | Total | % Full-Time |
| Frosh | 615 | 467 | 1082 | 98% |
| Sophomore | 638 | 380 | 1018 | 97.8% |
| Junior | 1053 | 775 | 1828 | 95.9% |
| Senior | 1396 | 1119 | 2515 | 88.6% |
| Total Undergraduates | 3701 | 2741 | 6442 | 93.7% |
| Masters | 257 | 133 | 390 | 71.3% |
| Credential | 57 | 36 | 93 | 96.8% |
| 2nd Bachelors | 13 | 30 | 43 | 62.8% |
| Other Post-Baccalaureate | 6 | 8 | 14 | 7.1% |
| Total Post Baccalaureate | 257 | 207 | 540 | 73.3% |
Fall 2019 Student Ethnicity
| | Female | Male | Totals | Percentage |
| Black | 122 | 95 | 274 | 3.1% |
| American Indian | 60 | 31 | 96 | 1.3% |
| Asian | 109 | 83 | 217 | 2.7% |
| Hispanic/Latino | 1437 | 900 | 2653 | 33.5% |
| Non Resident Alien | 52 | 47 | 118 | 1.4% |
| Pacific Islander | 10 | 11 | 21 | 0.3% |
| Two or more | 273 | 194 | 508 | 6.7% |
| Unknown | 255 | 187 | 525 | 6.3% |
| White | 1716 | 1400 | 3361 | 44.6% |
| Totals | 4034 | 2948 | 6983 | 100.0% |
Fall 2019 Average Unit Loads
| | Female | Male | Overall Average |
| Undergraduate - Full Time | 14.8 | 14.6 | 14.7 |
| Undergraduate - Part Time | 8.3 | 8.6 | 8.4 |
| Credential - Full Time | 20.5 | 20.1 | 20.3 |
| Masters - Full Time | 12.9 | 12.0 | 12.6 |
| Masters - Part Time | 5.8 | 5.4 | 5.6 |
| Overall Average | 14.8 | 14.6 | 14.7 |
Fall 2019 Geographic Origin of Current Students (based on prior institution)
| Region | Undergraduate | Post Baccalaureate | Totals | Percentage |
| Local | 764 | 309 | 1073 | 15.4% |
| Northern CA | 719 | 37 | 756 | 10.8% |
| SF Bay Area | 842 | 26 | 868 | 12.4% |
| Sacramento | 288 | 7 | 295 | 4.2% |
| Coast | 312 | 29 | 341 | 4.9% |
| Central CA | 483 | 6 | 489 | 7.0% |
| Los Angeles | 1997 | 28 | 2025 | 28.0% |
| San Diego | 504 | 13 | 517 | 7.4% |
| WUE States* | 329 | 29 | 358 | 5.1% |
| Other States | 167 | 47 | 214 | 3.1% |
| Foreign | 38 | 9 | 47 | 0.7% |
| Totals | 6443 | 540 | 6983 | 100% |
* WUE is a state exchange program with participants from 14 western states allowing students from these states to attend participating public colleges or universities in other states at a significantly reduced cost.
Fall 2019 Students Living in Campus Housing
| All Students in Campus Housing/Percent of Total Students | 1795 | 25.8% |
| New Undergraduates in Campus Housing/Percent of New Undergraduates | 723 | 88.0% |
Fall 2019 First Time Undergraduate Profile
Ethnicity
| | Female | Male | Total | % |
| Black | 19 | 12 | 31 | 3.8% |
| American Indian | 7 | 0 | 7 | 0.9% |
| Asian | 7 | 5 | 12 | 1.5% |
| Hispanic/Latino | 206 | 124 | 330 | 40.1% |
| Non Resident Alien | 3 | 4 | 7 | 0.9% |
| Pacific Islander | 0 | 1 | 1 | 0.1% |
| Two or more | 31 | 24 | 55 | 6.7% |
| Unknown | 23 | 18 | 41 | 5.0% |
| White | 191 | 147 | 338 | 41.1% |
| Totals | 487 | 335 | 822 | 100.0% |
Other Characteristics
| | Female | Male | Total |
| First Generation | 57.2% | 46.8% | 52.9% |
| Low Income | 57.9% | 53.3% | 56.1% |
| Average Unit Load | 14.6 | 14.3 | 14.5 |
| In Campus Housing | 87.9% | 87.8% | 87.8% |
Origin
| | Female | Male | Total |
| Local | 6.4% | 6.6% | 6.4% |
| Northern California | 10.9% | 11.6% | 11.2% |
| San Franciso Bay Area | 11.3% | 16.7% | 13.5% |
| Sacramento | 4.5% | 6.0% | 5.1% |
| Coast | 3.3% | 3.3% | 3.3% |
| Central California | 11.5% | 6.0% | 9.2% |
| Los Angeles | 34.5% | 33.7% | 34.2% |
| San Diego | 9.0% | 8.7% | 8.9% |
| WUE State | 5.7% | 6.3% | 6.0% |
| Other State | 2.5% | 0.6% | 1.7% |
| Foreign | 0.4% | 0.6% | 0.5% |
College of Major
| | Female | Male | Total |
| College of Arts, Humanities & Social Sciences | 24.6% | 20.0% | 22.7% |
| College of Natural Resources & Sciences | 43.1% | 49.9% | 45.9% |
| College of Professional Studies | 24.4% | 16.7% | 21.3% |
| Undeclared | 7.8% | 13.4% | 10.1% |
Average Annual College Summaries for 5 years
Average Annual Headcount
| College | 15/16 | 16/17 | 17/18 | 18/19 | 19/20 |
| Arts, Humanities & Social Sciences | 2153 | 2123 | 2081 | 1873 | |
| Natural Resources & Sciences | 3269 | 3216 | 3119 | 2911 | |
| Professional Studies | 2704 | 2642 | 2557 | 2343 | |
| General Studies | 311 | 251 | 256 | 280 | |
| University-Wide | 8436 | 8231 | 8011 | 7407 | |
Full-Time Equivalent Students (FTES)
| College | 14/15 | 15/16 | 16/17 | 17/18 | 18/19 |
| Arts, Humanities & Social Sciences | 3006.8 | 3003.1 | 2926.7 | 2810.5 | 2610.6 |
| Natural Resources & Sciences | 2849.4 | 2924.9 | 2897.6 | 2830.7 | 2555.4 |
| Professional Studies | 1874.9 | 1993.4 | 1940.7 | 1968.2 | 1881.0 |
| General Studies | 0.6 | 0.7 | 0.6 | 11.1 | 8.2 |
| University Wide | 7731.7 | 7922.1 | 7765.6 | 7620.5 | 7055.3 |
Full-Time Equivalent Faculty (FTEF)
| College | 14/15 | 15/16 | 16/17 | 17/18 | 18/19 |
| Arts, Humanities & Social Sciences | 136.4 | 138.7 | 141.0 | 140.8 | 131.8 |
| Natural Resources & Sciences | 135.5 | 141.0 | 147.2 | 149.1 | 136.1 |
| Professional Studies | 74.2 | 86.5 | 90.4 | 89.2 | 82.4 |
| | - | - | - | - | .1 |
| University Wide | 346.1 | 366.2 | 378.5 | 379.1 | 350.4 |
Student Faculty Ratio (SFR)
| College | 14/15 | 15/16 | 16/17 | 17/18 | 18/19 |
| Arts, Humanities & Social Sciences | 22.0 | 21.5 | 20.6 | 20.0 | 19.8 |
| Natural Resources & Sciences | 20.8 | 20.5 | 19.4 | 19.0 | 18.8 |
| Professional Studies | 24.4 | 22.9 | 21.2 | 22.1 | 22.8 |
| | | | | | |
| University Wide | 22.1 | 22.4 | 20.3 | 20.1 | 20.1 |
FTEF is calculated using the CSU Chancellor's Office methodology from the CDPS Course Section Report and then rolled up to the College offering the class. This represents the FTEF used to teach courses in each College and may not match the FAD report which summarizes FTEF by department of appointment. Therefore, the Student /Faculty Ratios indicate the actual instructional experience in each College. (IE source:dm_instrload)
The historical data is portrayed according to the current college configuration of departments.
Fall 2019 Faculty Data
at October 31, 2019
| | Female | Male | Total |
| Tenured/Tenure Track | 125 | 118 | 243 |
| Lecturer (Temporary) | 176 | 115 | 291 |
| University Totals | 301 | 133 | 534 |
Fall 2019 Faculty Data (by position type)
| | Female | Male | Total |
| Professor | 43 | 65 | 108 |
| Associate Professor | 36 | 22 | 58 |
| Assistant Professor | 46 | 31 | 77 |
| Lecturer (Temporary) | 176 | 115 | 291 |
| University Totals | 301 | 233 | 534 |
Fall 2019 Faculty Ethnicity
Tenured/Tenure Track Lecturer
| | Female | Male | Female | Male |
| American Indian/Alaska Native | 6 | 4 | 5 | 1 |
| Asian | 7 | 7 | 7 | 3 |
| Black | 3 | 4 | 4 | 1 |
| Hispanic | 9 | 4 | 7 | 9 |
| Native Hawaiian/Other Pacific Islander | 0 | 0 | 1 | 0 |
| White | 80 | 93 | 120 | 83 |
| Two or More | 4 | 2 | 9 | 4 |
| Unknown | 16 | 7 | 23 | 11 |
| University Sub-Totals | 125 | 121 | 176 | 112 |
| University Totals | 246 | 288 |
Accessibility Assurance for Accountability and Transparency
We are committed to accessibility and are making every effort to provide our data and reports in a manner that is easy to navigate and accessible to all. If you have suggestions or have problems viewing items on this site or any of the attached documents, please e-mail the webmaster at ie@humboldt.edu. We appreciate your input! Click here to download Adobe Reader to view PDF files. Click here to download Microsoft PowerPoint Viewer.